Visualize Pelican Prometheus Metrics with Grafana
Pelican added offical support for Grafana in
v7.6.0. Older versions of Pelican are not guaranteed to work with Grafana.
Pelican servers have Prometheus (opens in a new tab) embedded. In the Web UI of the origin server, Pelican has a visualization of data transfer metrics collected. There are many other metrics that Pelican collects but are hidden from UI. You may unleash the potential of the hidden metrics by building a customized Pelican server monitoring dashboard. To do this, we recommend using Grafana (opens in a new tab), an open-soure analytics and interactive visualization software. This documentation will get you started on connecting Grafana to Pelican.
Before starting, make sure you have set up and run a Pelican server. For how to serve a Pelican server (origin, cache, registry, or director), please refer to previous sections.
If you already have Grafana installed, skip to Connect Grafana to Pelican.
Set up Grafana
Grafana can be accessed via Grafana Cloud or as a self-managed software. This documentation will focus on running Grafana locally. If you are interested in using Grafana Cloud, visit this link (opens in a new tab) for details.
This section briefly introduces downloading, installing, and starting Grafana on a Linux system. For detailed instructions, refer to Grafana Documentation (opens in a new tab).
Install Grafana
Follow the link https://grafana.com/grafana/download?pg=get&plcmt=selfmanaged-box1-cta1 (opens in a new tab) to download Grafana based on your operating system then follow Grafana documentation (opens in a new tab) to install Grafana. This documentation uses Grafana Enterprise edition with version 10.3.3.
Start Grafana
On a Linux system, you can start Grafana with systemd. For starting Grafana on other operating systems, refer to Start Restart Grafana (opens in a new tab).
-
To start the service, run the following commands:
bashsudo systemctl daemon-reload sudo systemctl start grafana-server sudo systemctl status grafana-server -
To verify that the service is running, run the following command:
bashsudo systemctl status grafana-server
Initialize Grafana
To sign in to Grafana for the first time, follow these steps:
-
Open your web browser and go to the root URL. Unless you have configured Grafana differently, it is set to use http://localhost:3000 (opens in a new tab) by default.
-
On the signin page, enter
adminfor username and password. -
Click Sign in.
-
If successful, you will see a prompt to change the password.
-
Click OK on the prompt and change your password.
Note: We strongly recommend that you change the default administrator password.
Connect Grafana to Pelican
This section describes how to connect Grafana to the Pelican Prometheus instance. Grafana has built-in support for many data sources and you will need to add a new Prometheus data source first before configuring it for Pelican. What are Grafana data sources? (opens in a new tab)
Before start
-
Run your Pelican origin server. You may run other Pelican servers, but in this documentation we will use the origin server for demonstration.
pelican origin serve -v /tmp/stash:/test-namespace -f "osg-htc.org" -
Go to the URL for Web UI and confirm it's working. The default URL is
https://localhost:8444. You should be directed to the Pelican login page.
Add a data source
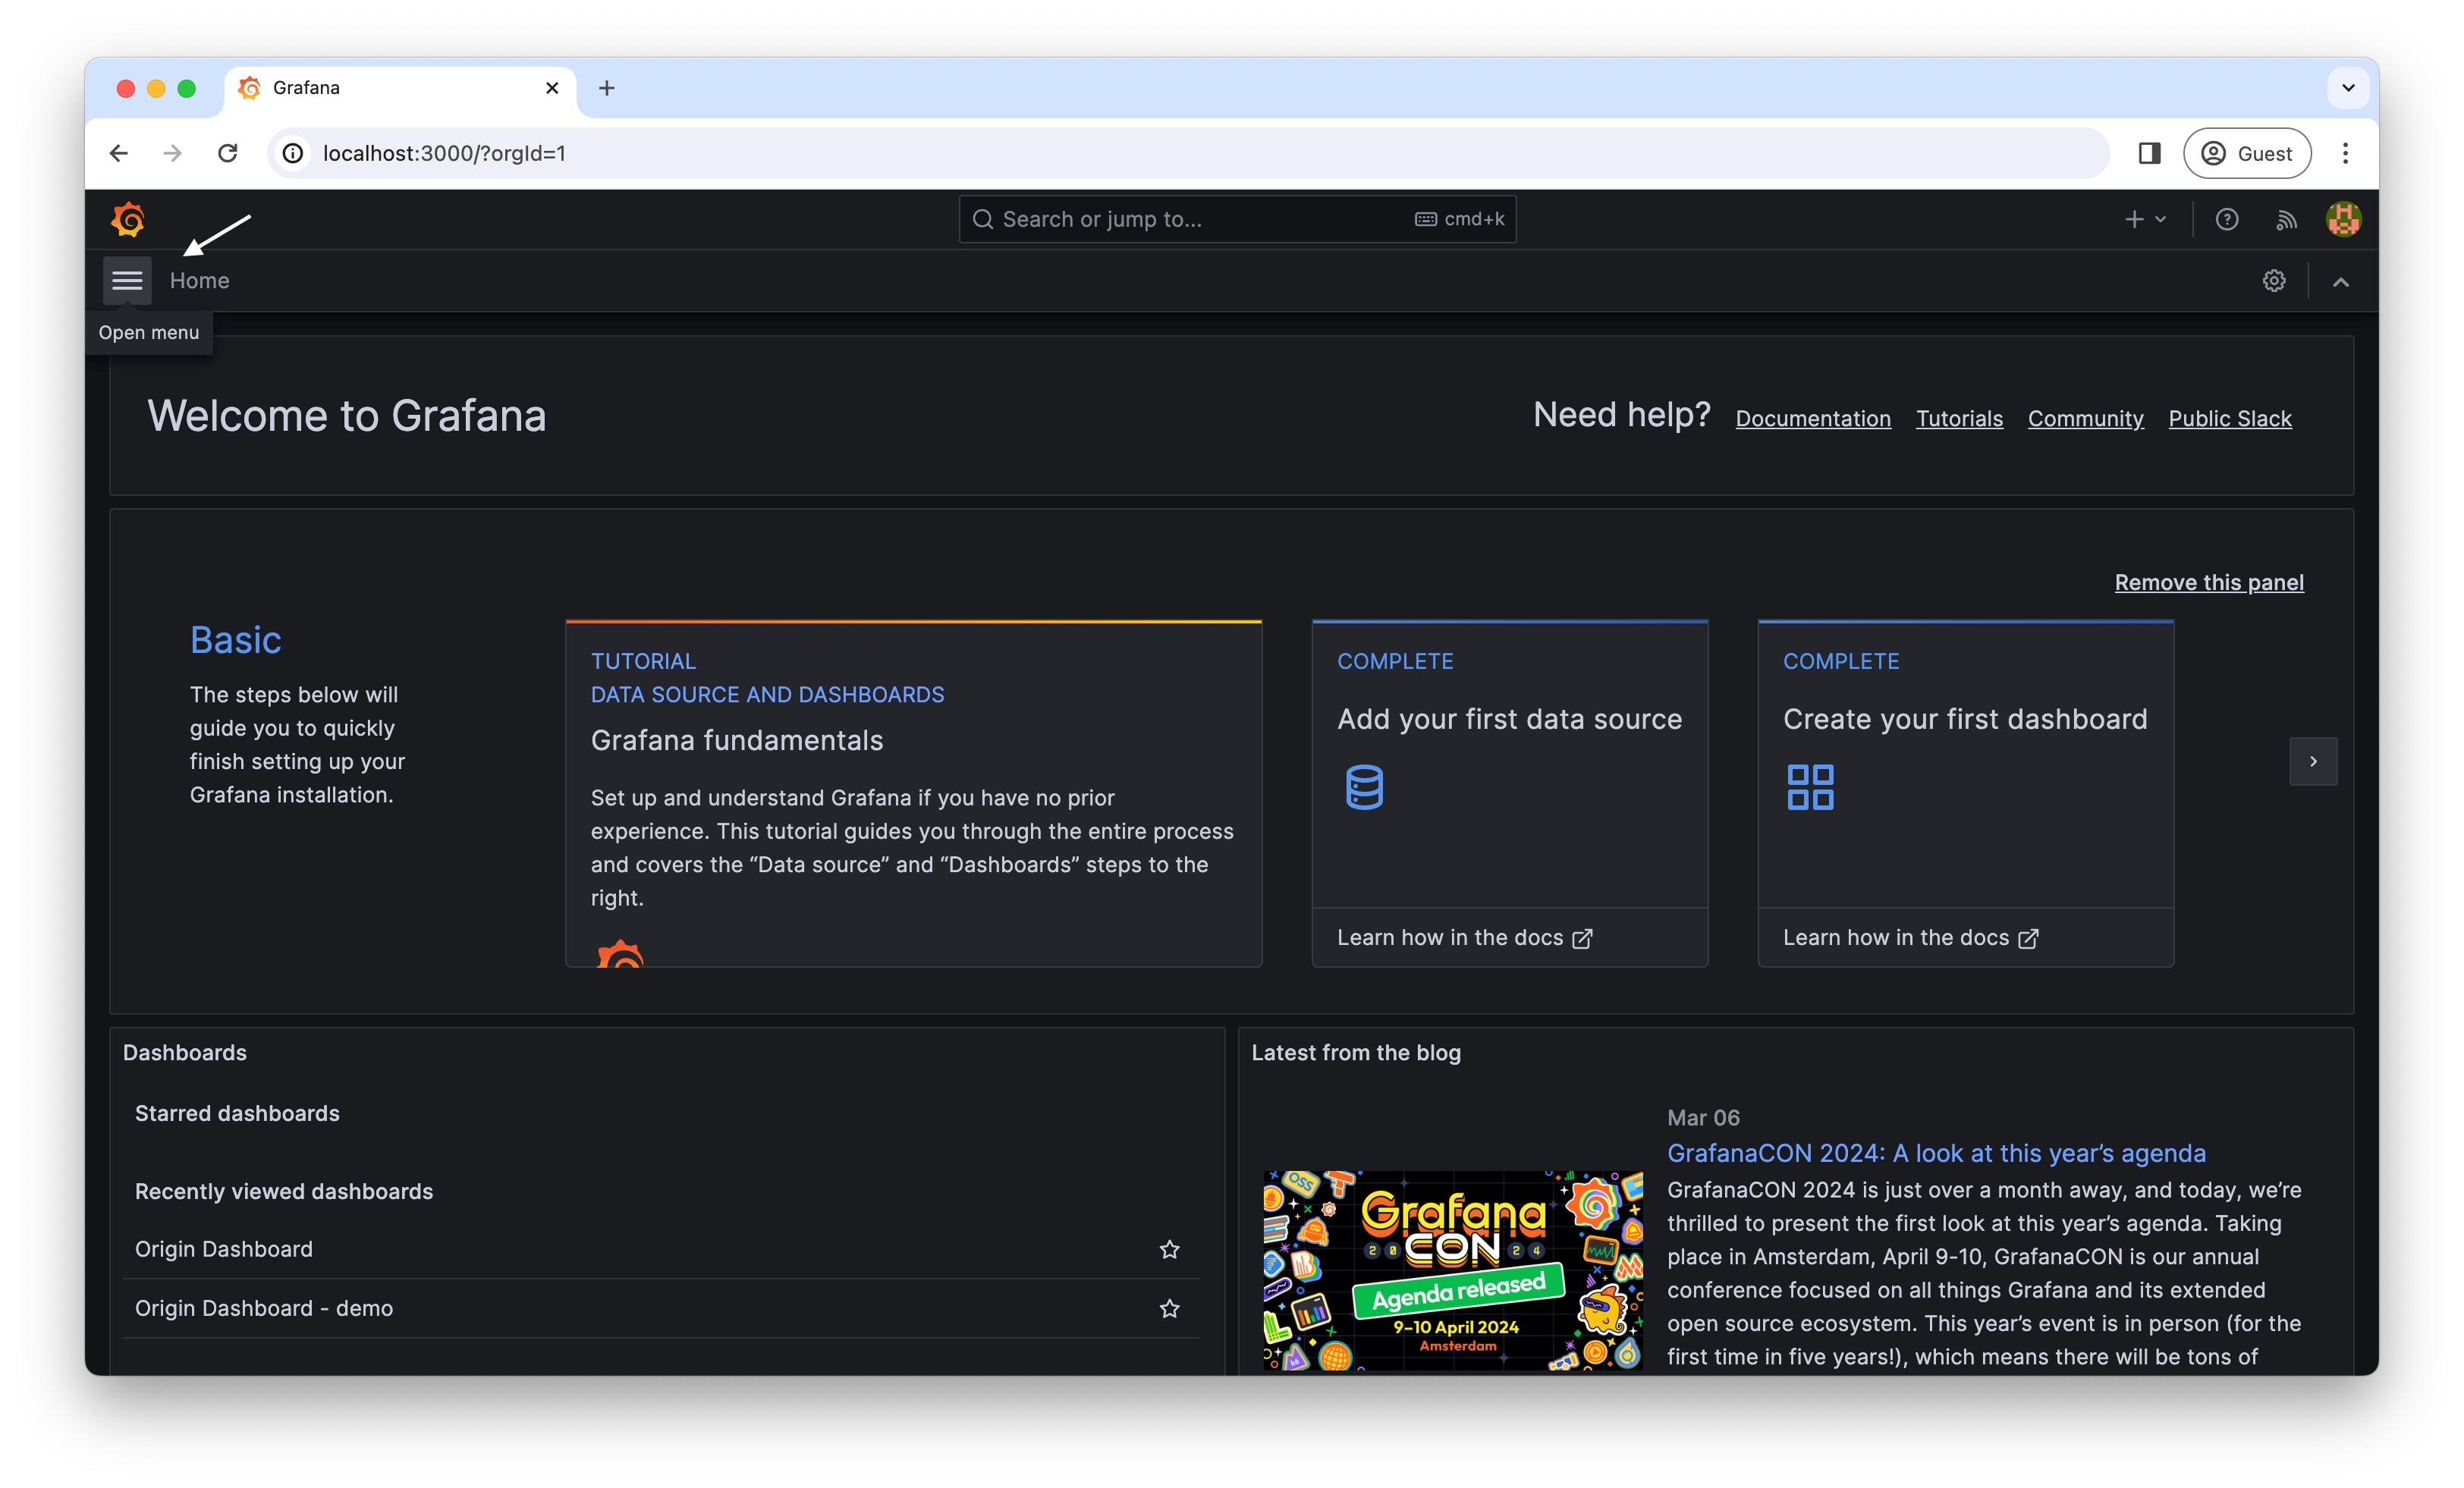
- Click Connections in the left-side menu. If there is no menu on the left-side, click the icon of stacked bars to toggle the menu. This is located on the top-left side of the page next to Home
- Enter Prometheus in the search dialog
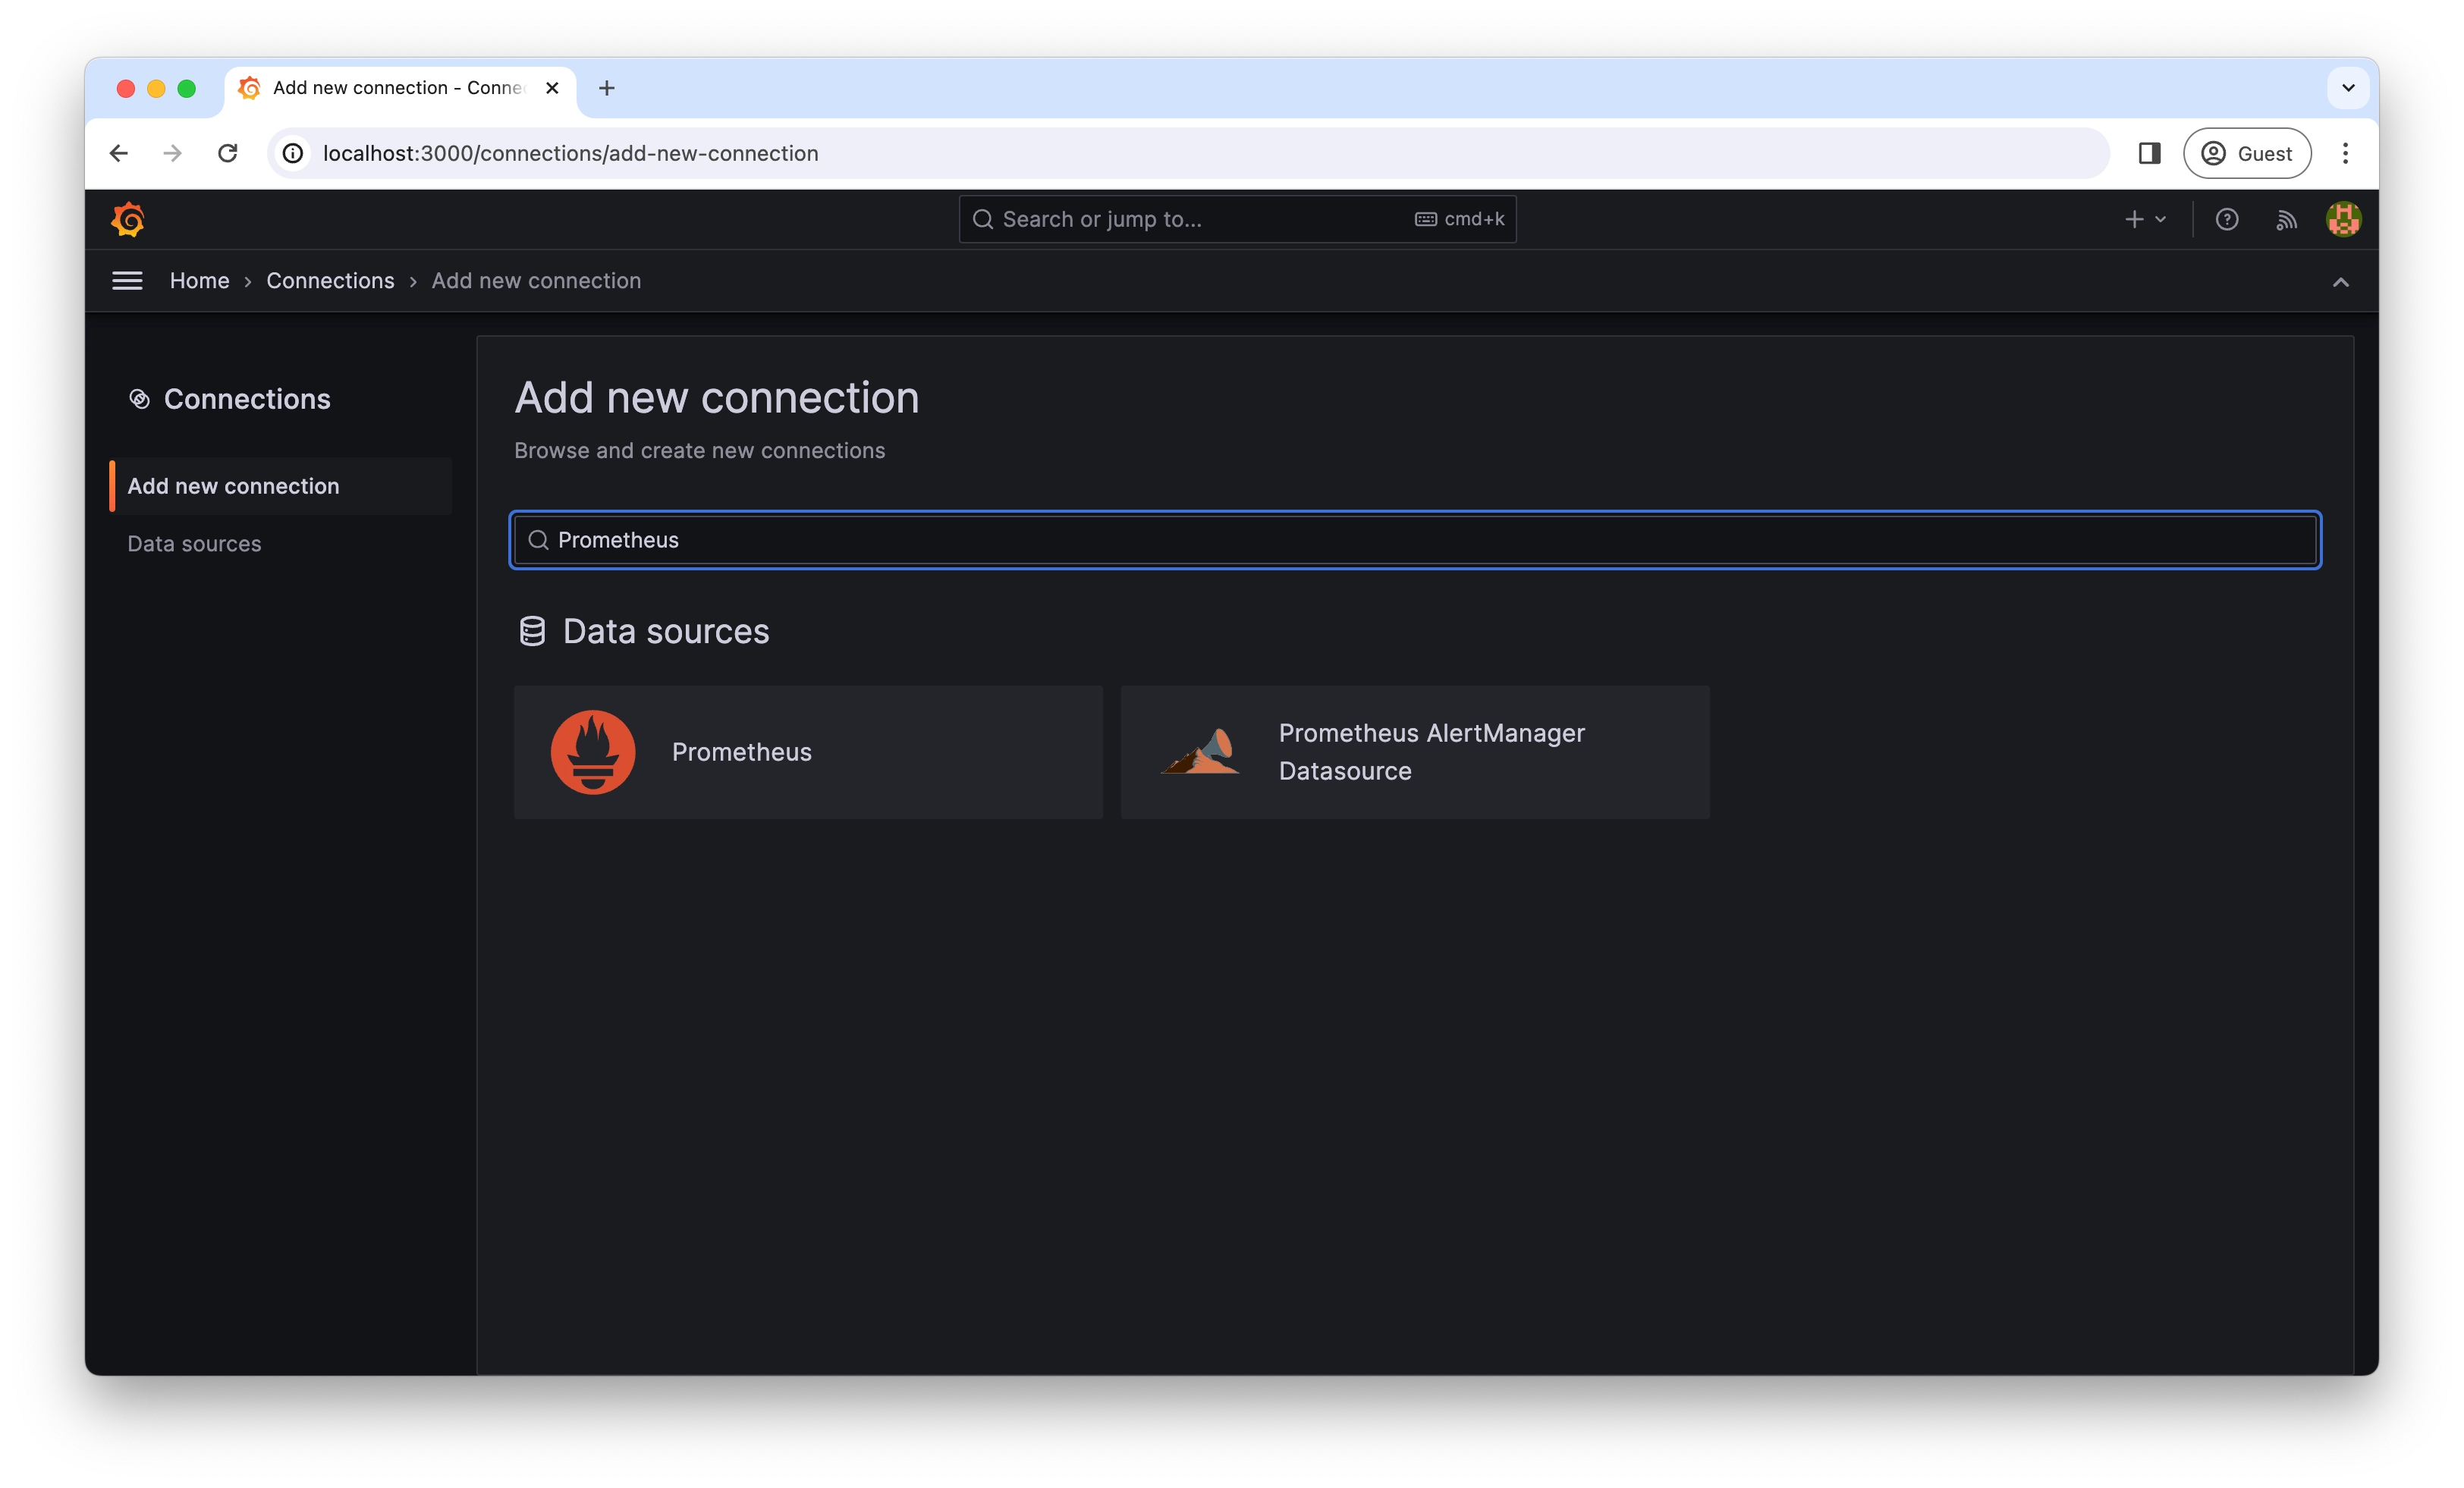
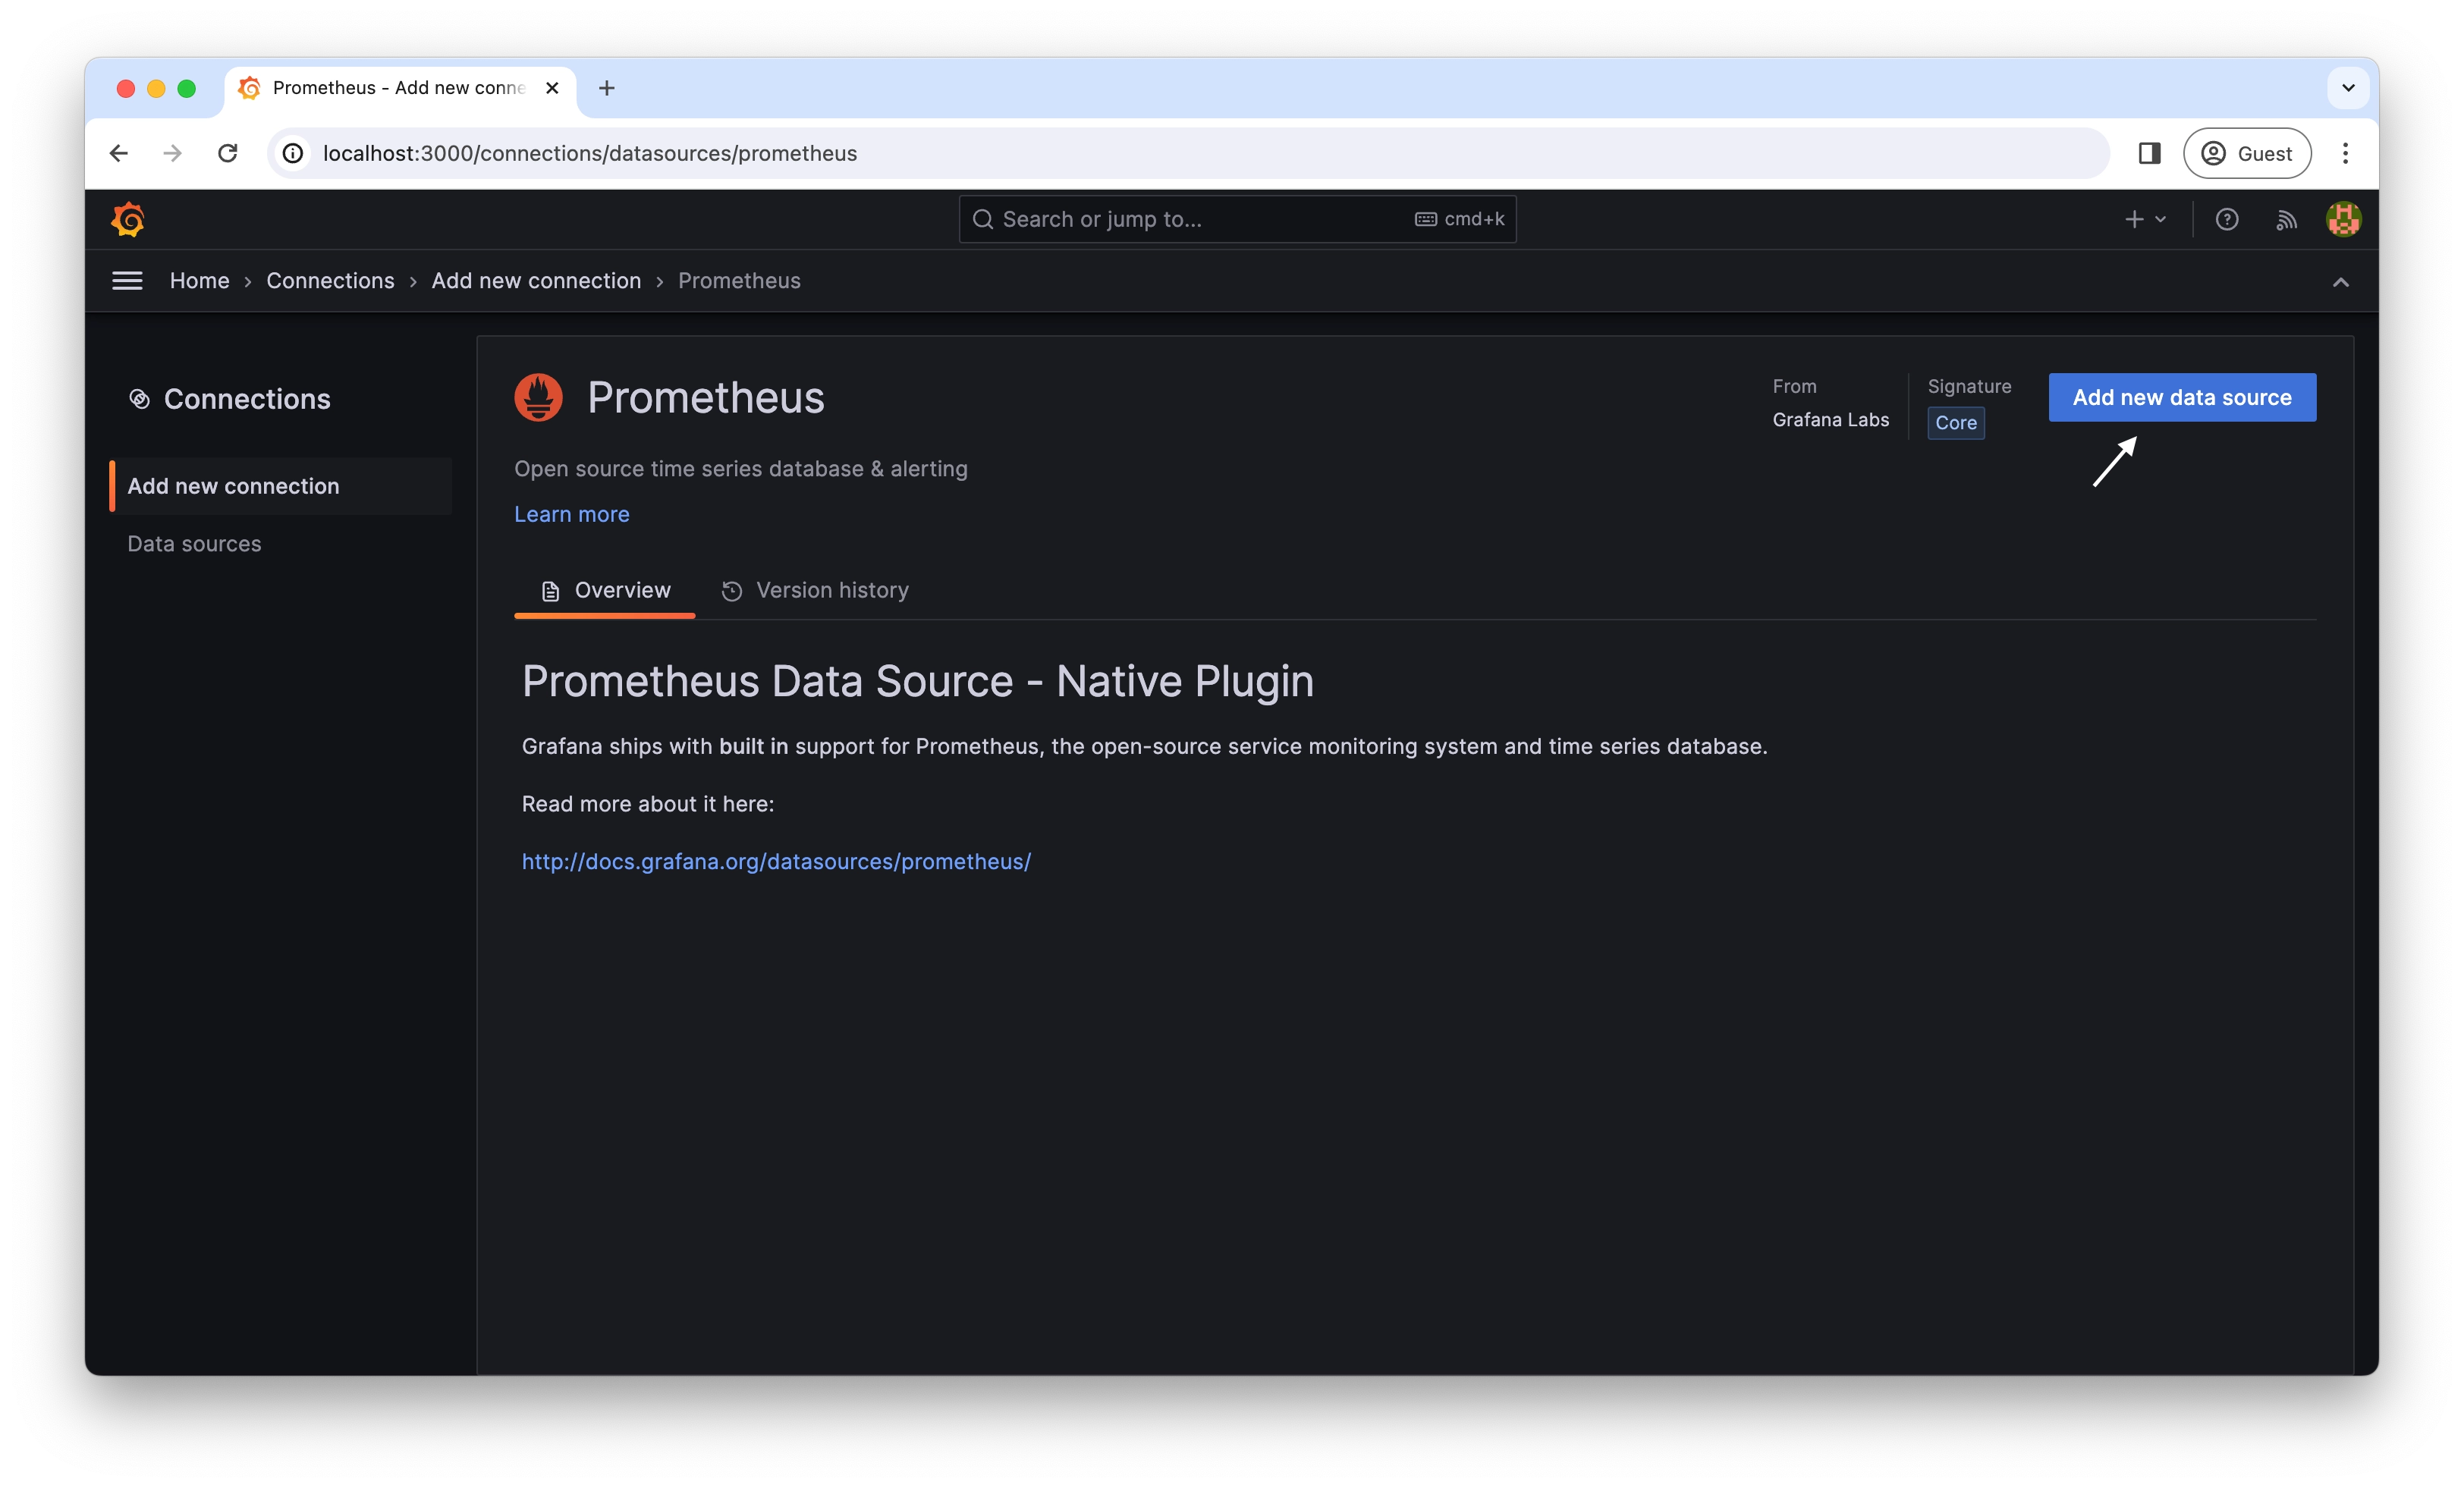
- Click Prometheus and click Add new data source
- Configure the data source following instructions in the next section
Configure the data source
Follow the instructions below to configure your Prometheus data source to work with Pelican. Each subsection is equivalent to the subsection on the Grafana data source configuration page.
Connection
- Name: Change the name to
Pelican Prometheus, or any name to distinguish it from other data sources
Authentication
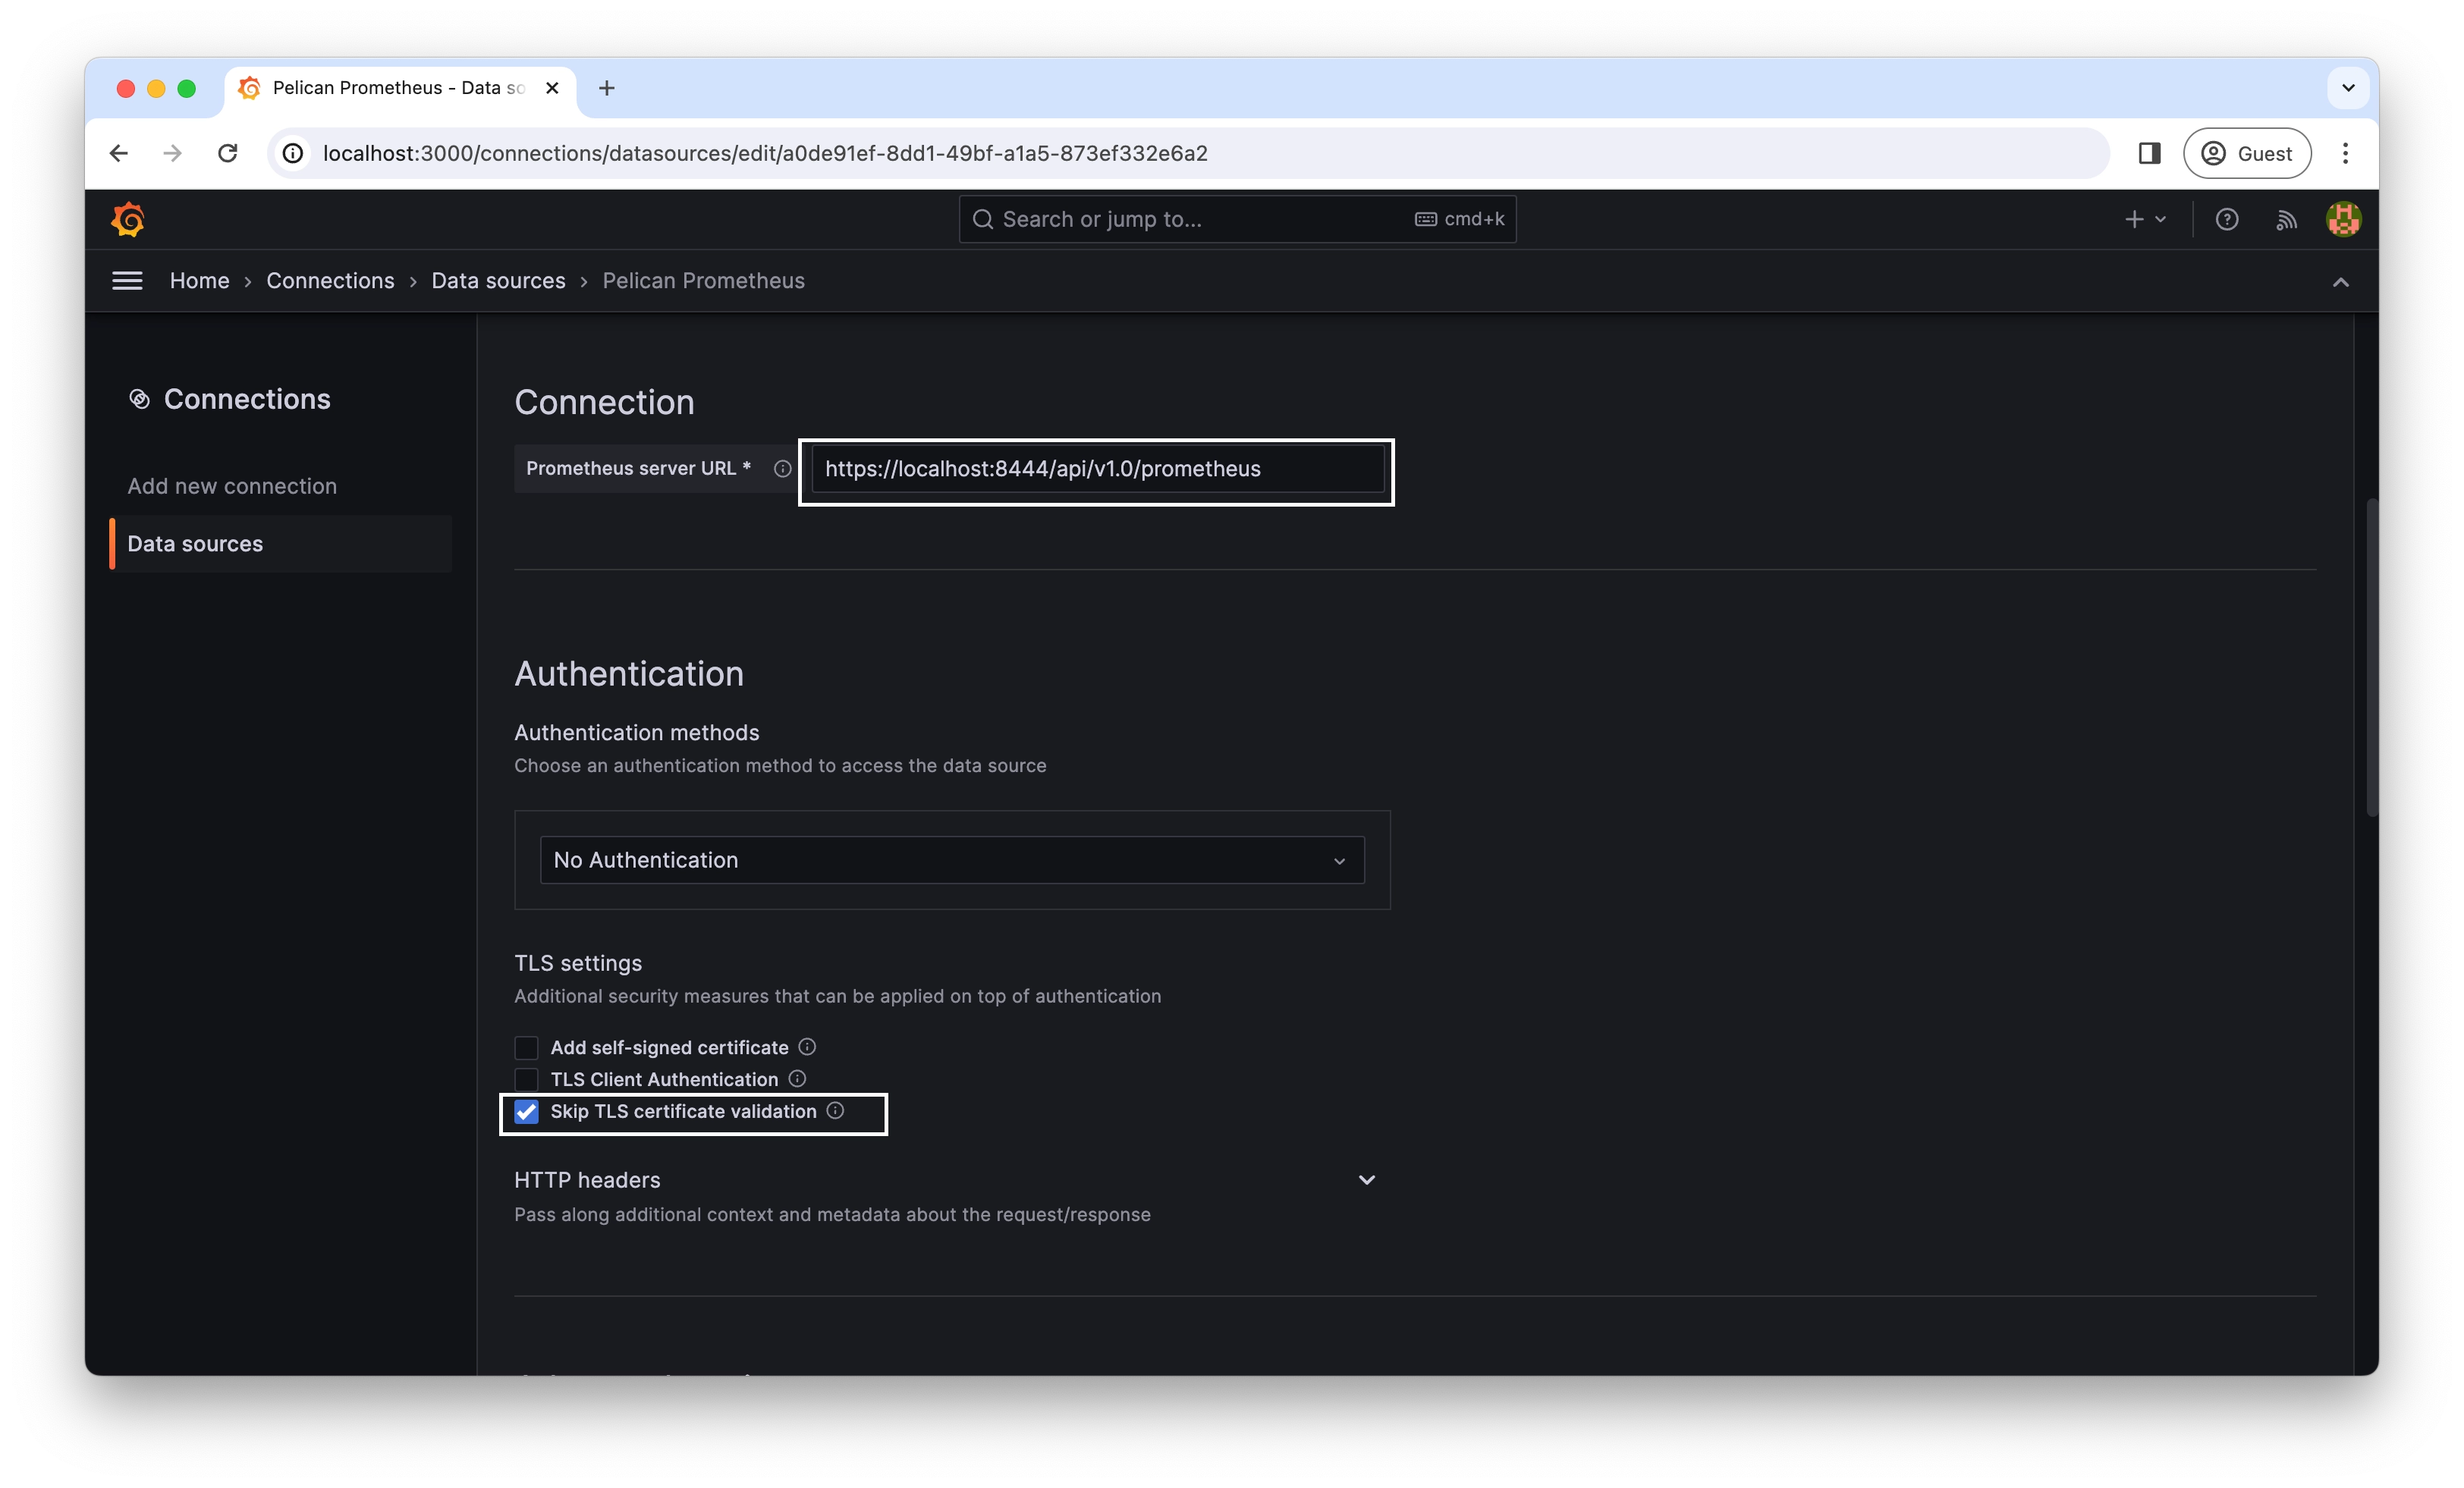
-
Prometheus server URL:
https://<server-hostname>:<server-web-port>/api/v1.0/prometheusWhere
<server-hostname>:<server-web-port>is your Pelican server Web URL that Grafana can access. By default, it's https://localhost:8444 (opens in a new tab) -
TLS settings: Check "Skip TLS certificate validation" if you don't have a TLS certificate for your Pelican server, or if you are in local development environment
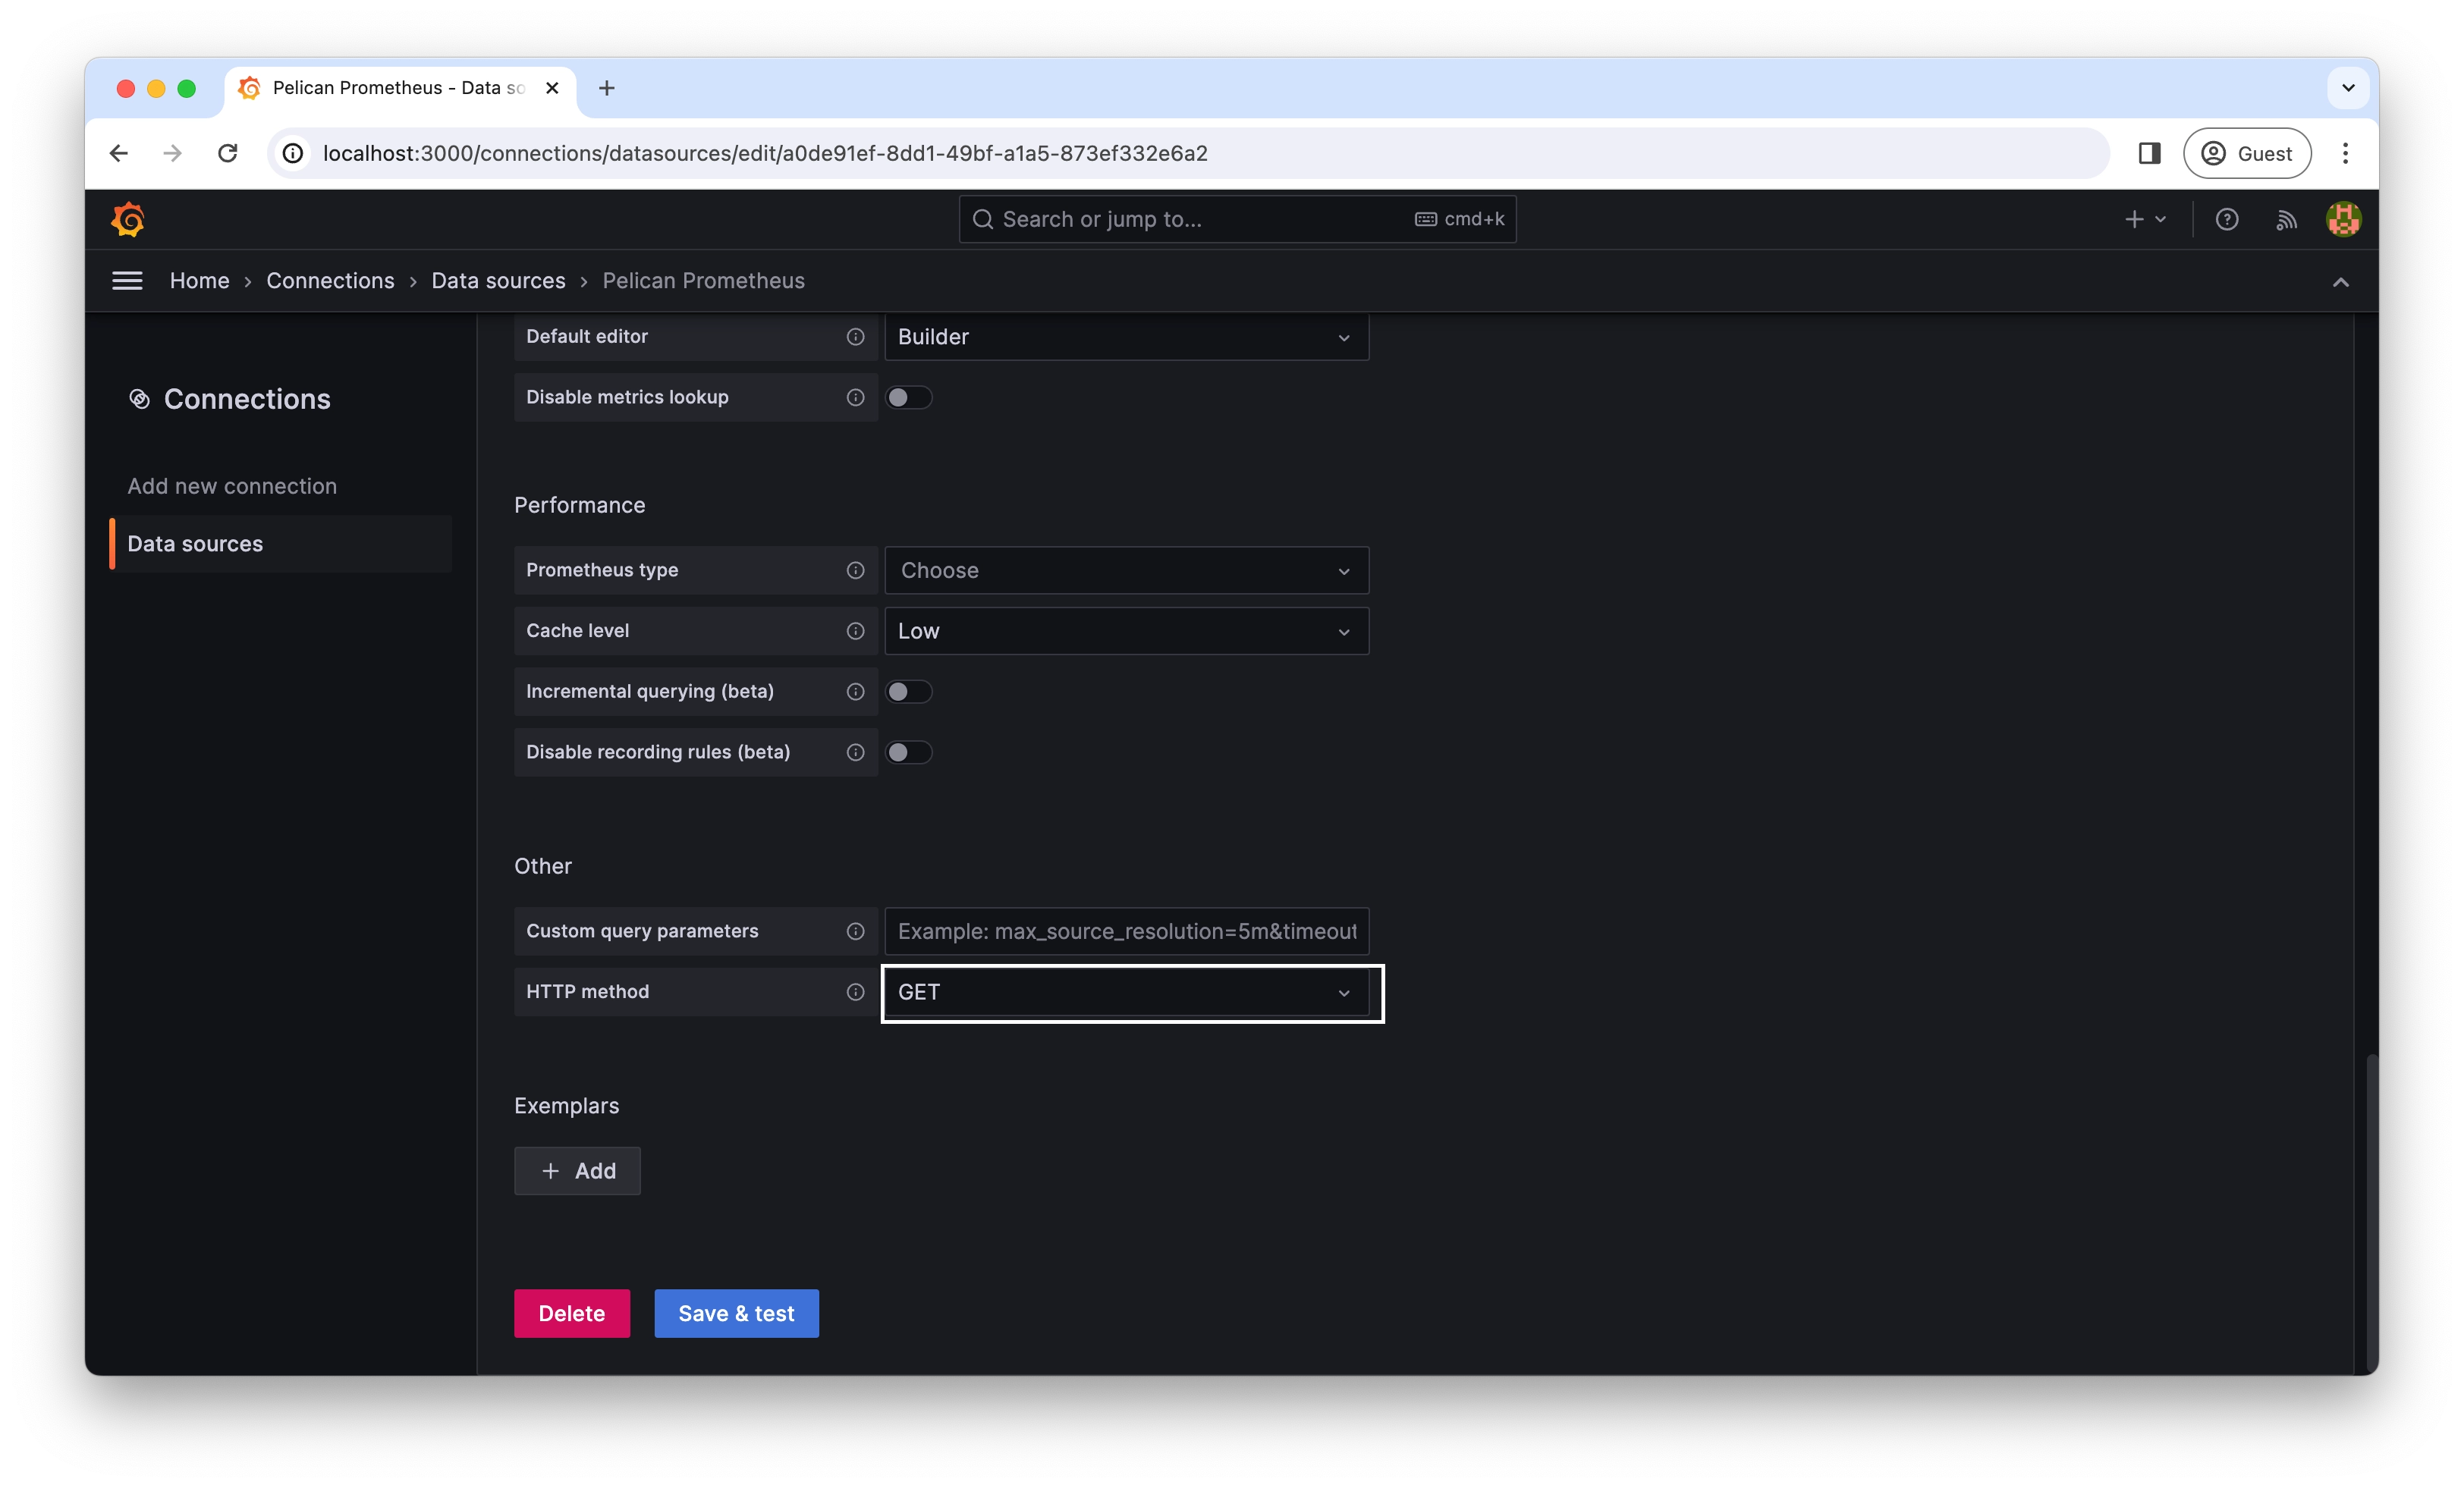
Advanced settings
- Other: Select
GETfor "HTTP Method"
Before finishing the configuration, you need to set up authentication credentials for Grafana to access Prometheus instance on Pelican or change Pelican configuration to disable authentication. Follow the next section for instructions.
Configure authentication
This section describes how to configure Grafana to have proper authentication credentials to access a Prometheus instance on Pelican or how to turn off Pelican authentication for Prometheus. Depending on your deployment, you may prefer one way over the other.
Authenticated Prometheus
By default, Pelican protects the Prometheus endpoint by asking for a JWT (opens in a new tab) to verify the user accessing the endpoint. It reads Bearer <token> from Authorization header during any HTTPS request to /api/v1.0/prometheus and its subpath. You need to create a JWT using the Pelican CLI and pass it to Grafana.
-
Run the following command
-
Replace
<server-web-url>with the URL to your Pelican server Web UI. By default, it'shttps://localhost:8444. -
Replace
--lifetime 604800with your desired lifetime for the token. The value is in seconds. The example below generates a token with a lifetime of 7 days.
bash$ pelican origin token create --scope monitoring.query --claim wlcg.ver=1.0 --issuer <server-web-url> --subject grafana --audience <server-web-url> --lifetime 604800 eyJ0eXAiOiJKV1QiLCJhbGciOiJIUzI1NiJ9.eyJpc3MiOiJodHRwczovL2V4YW1wbGUuY29tIiwiaWF0IjoxNzA5NjUwMjMyLCJleHAiOjE3NDExODYyMzIsImF1ZCI6Imh0dHBzOi8vZXhhbXBsZS5jb20iLCJzdWIiOiJncmFmYW5hIiwic2NvcGUiOiJtb25pdG9yaW5nLnF1ZXJ5Iiwid2xjZy52ZXIiOiIxLjAifQ.cK5QyYJinn3QCPa6YB10Wn37MEEKzt_kyDMR9meN1Ec -
-
Copy the generated token. Note that your token will be different from the example above.
-
In the Grafana data source configuration page, go to the Authentication section, expand the HTTP Headers subsection, and click Add header
-
Fill in
Authorizationfor the Header field andBearer <token>for the Value field with your generated token. Note that there is a whitespace betweenBearerand your token.
That's it! Now you can scroll to the bottom of the configuration page and click Save & Test. There should be green alert with a title Successfully queried the Prometheus API.
Unauthenticated Prometheus
If for any reason it's not possible to attach an authorization token for Grafana, Pelican also allows you to turn off Prometheus authentication. You can toggle the configuration value Monitoring.PromQLAuthorization and set it to false to allow unauthenticated access to Prometheus. You can either set the value by the configuration file or by the environment variable.
Set through configuration file
The Pelican configuration file is located at /etc/pelican/pelican.yaml for root users, or ~/.config/pelican/pelican.yaml for non-root users
Append the following lines to your pelican.yaml file:
# Other configurations ...

Monitoring:
    PromQLAuthorization: false
Note that you need to restart the Pelican server to apply the changes.
Set through environment variable
The environment variable for the configuration is PELICAN_MONITORING_PROMQLAUTHORIZATION.
You can either export this environment variable or append it before your command to run Pelican.
export PELICAN_MONITORING_PROMQLAUTHORIZATION=falseor
PELICAN_MONITORING_PROMQLAUTHORIZATION=false pelican origin serveOnce you configured the authentication either in Grafana or in Pelican, click Save & Test to see if the connection can be established.
Build Monitoring Dashboard
With Grafana connected to the Pelican Prometheus instance, you are able to build visualization with the metrics Pelican collects. This section describes how to get started with a template dashboard configuration for a Pelican origin server. For a detailed guide on how to create a Grafana dashboard, refer to the Grafana documentation (opens in a new tab).
Before start
-
Make sure your Pelican origin server is running
-
Download the template dashboard file from here (opens in a new tab)
Modify dashboard template
There are a couple of placeholders that need to be changed before you can import the dashboard template to Grafana. To do a batch replace, it is recommended that you use a text editor to find and replace placeholders to corresponding values.
-
Replace
<YOUR-DATA-SOURCE-UID>to the id of your Prometheus data source. You can find the ID on the data source configuration page.-
Navigate to the configuration page
-
Copy the ID from your browser's URL box, which should have a value similar to
http://localhost:3000/connections/datasources/edit/fc2115e0-ede3-4fdb-9056-ecefa1b3160aWhere
fc2115e0-ede3-4fdb-9056-ecefa1b3160ais the ID you want to copy. Note that the ID in the example above will be different from your data source ID -
Batch replace
<YOUR-DATA-SOURCE-UID>in the template dashboard file with the copied value
-
-
Batch replace
<YOUR-ORIGIN-SERVER-WEB-URL>with the web URL of your Pelican origin server, without thehttps://portion. Example:localhost:8444 -
Save the changes to your template dashboard file.
Import template file to Grafana
-
Go to the home page of Grafana
-
Click Dashboards in the left-side menu. If there is no menu on the left-side, click the icon of stacked bars to toggle the menu, which is located on the top-left side of the page next to Home
-
Click the New button on the top-right side. Select the Import option in the dropdown menu.
-
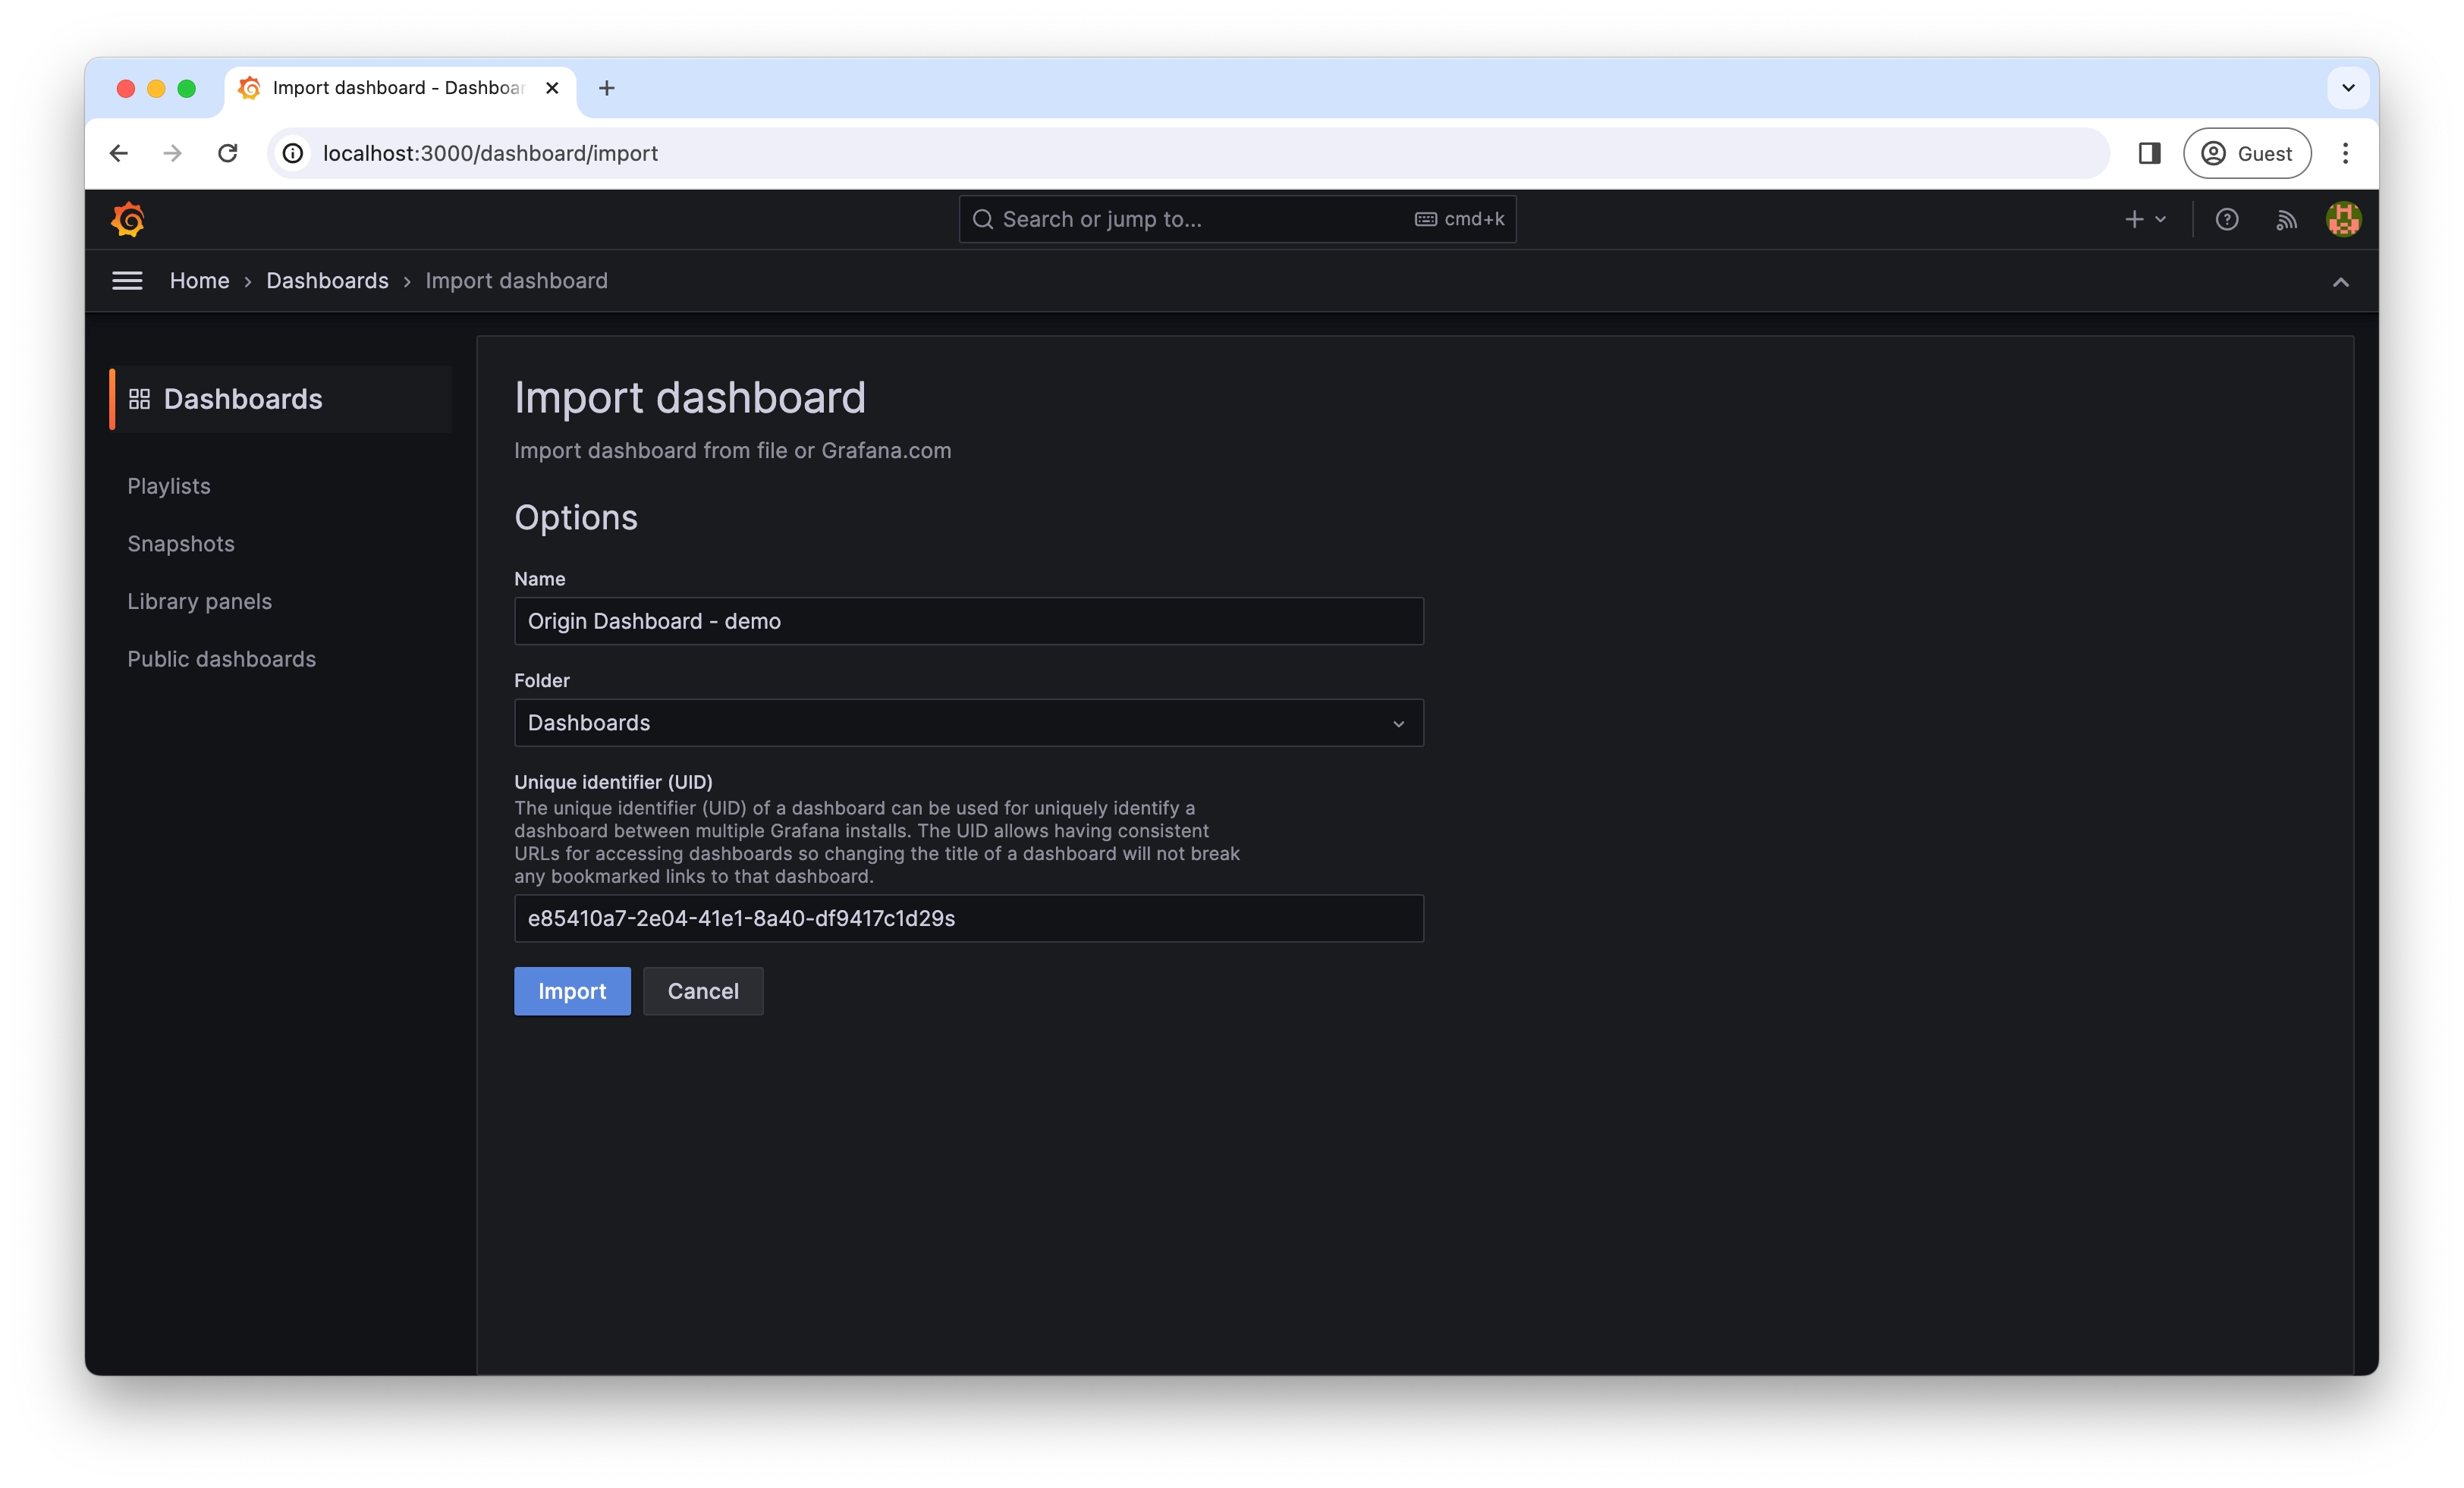
Drag and drop the template JSON file from your computer to the upload section of the page. It should look like the screenshot below.
-
Click Import
Grafana should then redirect you to the page of the import dashboard, which should look like the screenshot below.
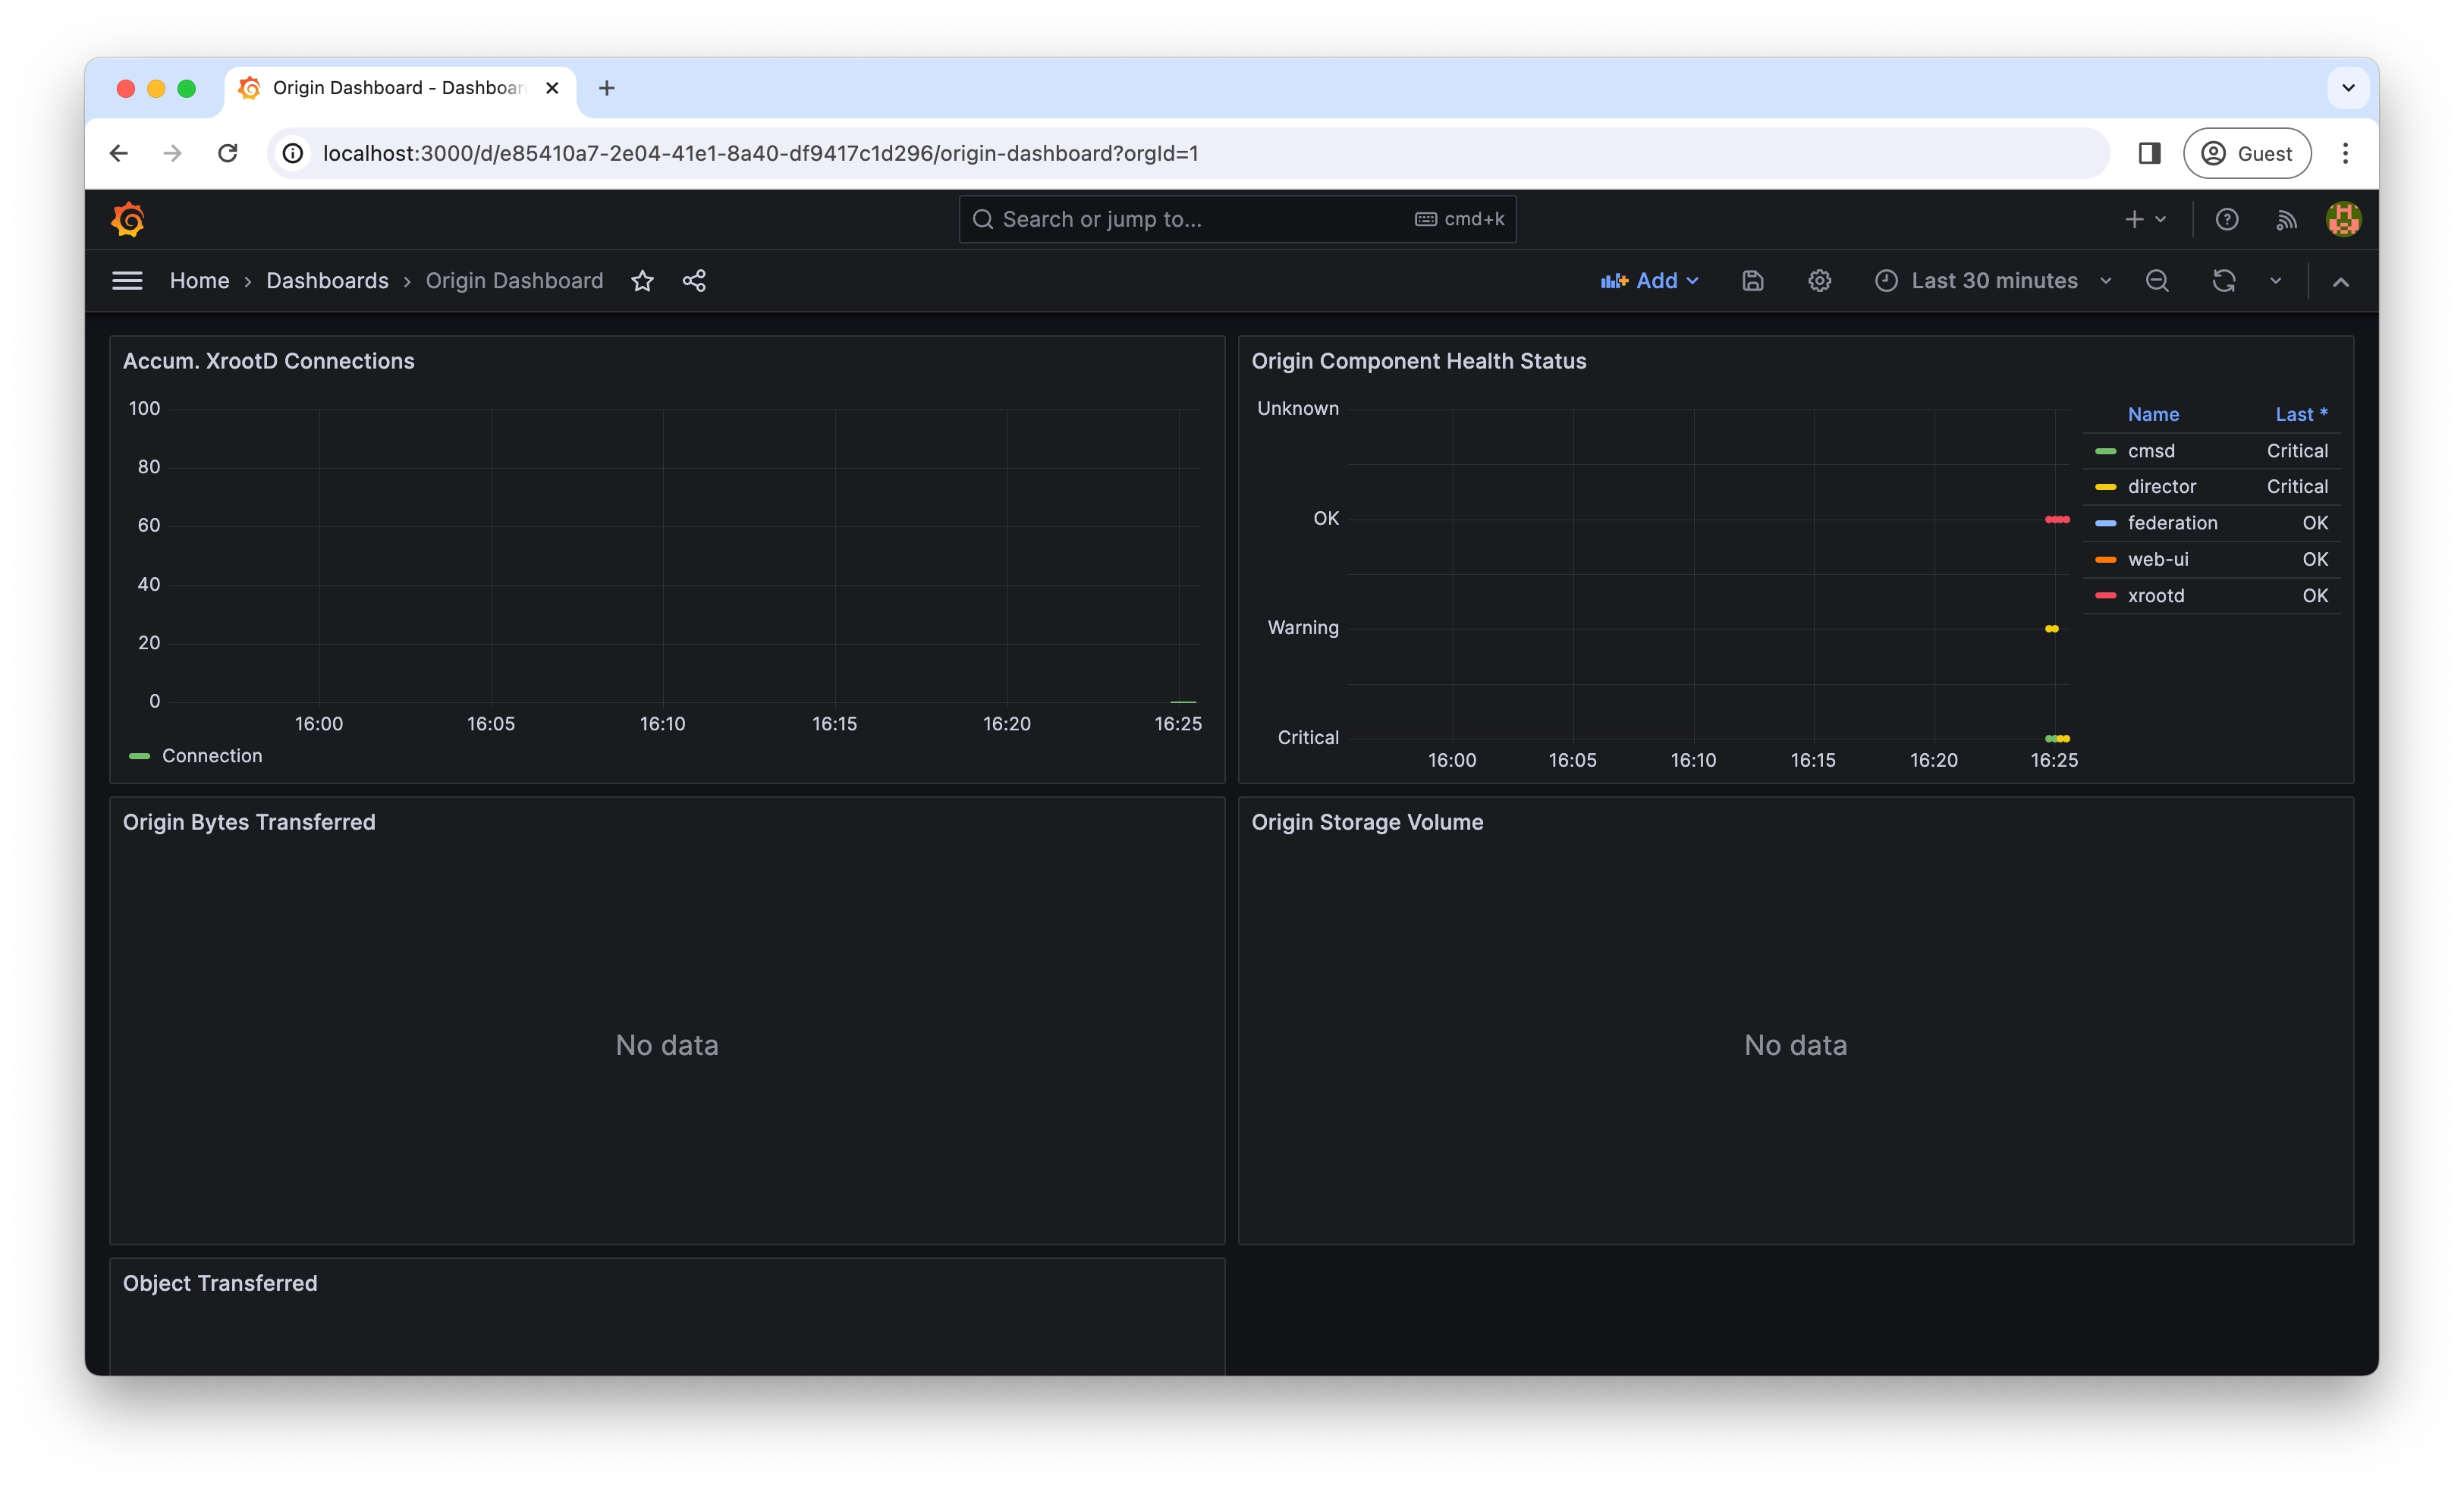
You may notice that some panels have a No data warning. This should go away once you have run your server for a couple of minutes and refreshed the page. It takes about 15s for Pelican to collect the initial data points and there could be delay in visualizing the data.
That's it! Feel free to modify the dashbord to tailor to your needs. For a list of available Prometheus metrics to query, please refer to the previous section (opens in a new tab).